Debug
Allows you to analyze code execution in real time.
Introduction
During coding, it's often necessary to analyze code execution.
In the case of Netuno, we can use:
_out.print- To display some information in the output._log.info- To display some information in the Netuno server terminal.
However, there are also more complex scenarios where we want to analyze in greater depth, for example, checking multiple values of objects and variables simultaneously, testing the execution of some specific code in this context, all to better understand the behavior.
In these more complex cases, it's always possible to use the methods shown above, such as _out.print and
_log.info, but this can be a very laborious and confusing process to achieve a good
understanding of what's happening.
Debugging (debug) serves precisely to provide a good understanding of what's happening, especially in more complex situations.
Debugging is the process used in development to find and reduce defects, failures, erroneous behavior, etc.
Debugging can be divided into three main mechanisms:
- Breakpoint: Stops code execution, allowing us to begin investigating where the code is stopped.
- Watch: Allows us to observe the values of variables where the code is stopped.
- Code Execution: We can temporarily execute any code to perform some testing at the point where execution is stopped for debugging.
Breakpoint
The breakpoint is where execution in the code should be paused to begin the debugging process.
To start debugging any code in any language supported by Netuno, such as JavaScript, Python, Ruby, Kotlin, or Groovy, place the following code where you want to start debugging:
- JavaScript
- Python
- Ruby
- Kotlin
- Groovy
_exec.debug()
_exec.debug()
_exec.debug()
_exec.debug()
_exec.debug()
Since Netuno is polyglot, it works with any supported language, such as JavaScript, Python, Kotlin, Ruby, or Groovy.
To start debugging, run the code, and execution will pause.
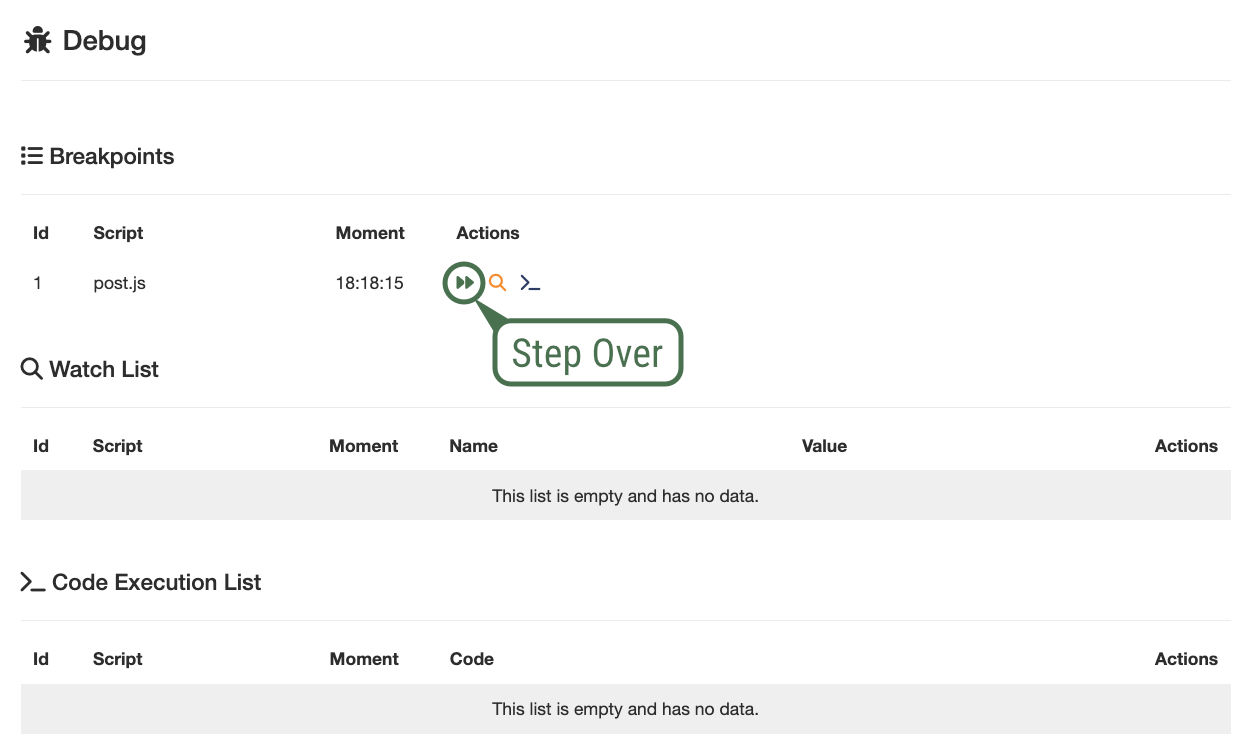
Then go to the development interface, in the back office, and select 'Build'. In the left-hand menu, you'll find the following option:
- Debug
Where can we find the double green arrow that indicates that by clicking on it, execution can continue:

The double green arrow interrupts the debugging pause, causing code execution to continue normally from the point where it left off.
Watch
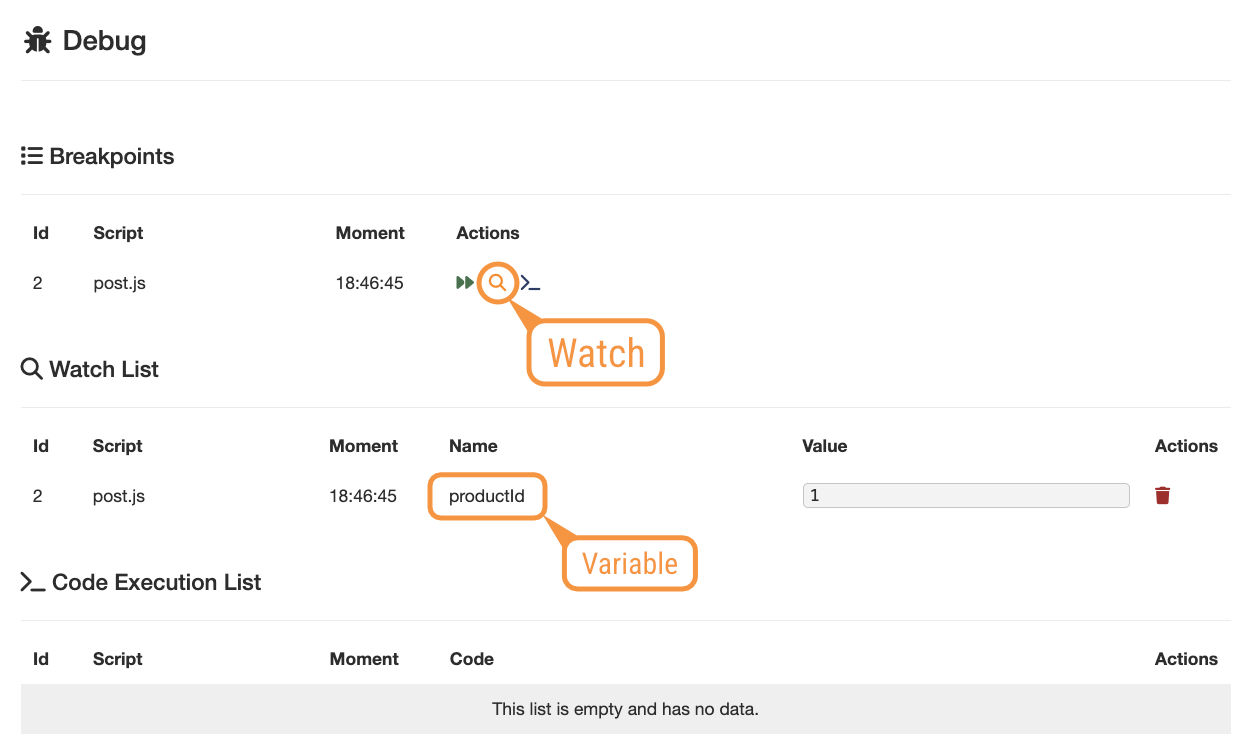
To view the values of variables, we use the yellow magnifying glass.
By clicking on the yellow magnifying glass, we can enter the name of the variable whose value we want to view.

The name of the variable and its current value appear in the list. We can see the value of several variables. If any variable does not exist, then there will be no value.
Execute Code
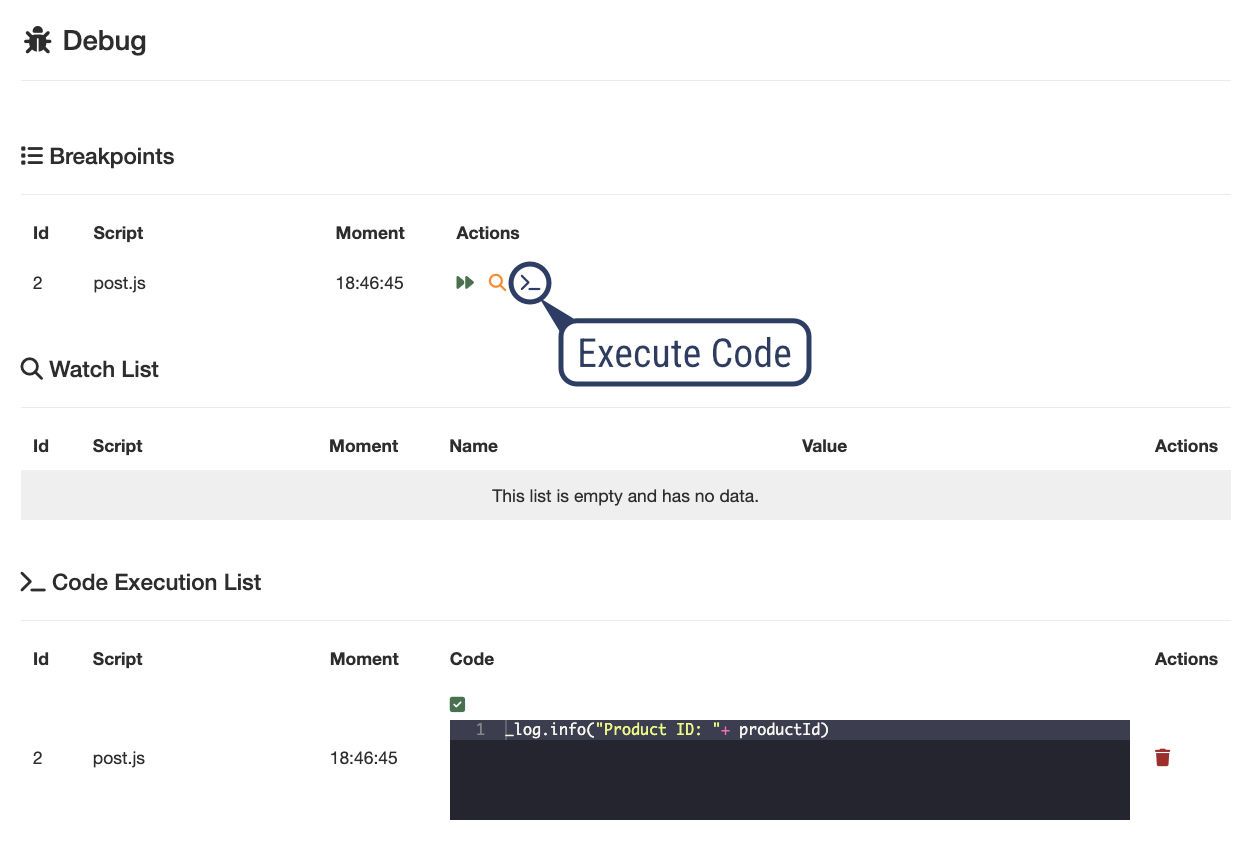
We can inject code to be executed in the context of the breakpoint, that is, where debugging is taking place.
We click the blue code symbol and we can insert the code we want to execute.

The executed code is presented in the list below, indicating that the code was executed successfully. If there is an error, the error message is displayed along with the code.
Configuration for Remote Debugging
When running Netuno locally, no configuration should be necessary.
Because in local development, the WebSocket address's host is configured automatically.
For local addresses, these values are typically used as the host:
localhost127.0.0.1192.168.1.*- Example of any local network IP address.my-app.local.netu.no
Local addresses don't require any configuration, so this step can be skipped.
In production or remote development, such as in a container or VPN, it may be necessary to define the external address (IP or domain) used for the WebSocket connection.
In this case, navigate within the application being developed to the environment configuration file. In this example, we'll use the development environment file, located at:
- 📂
config/_development.json
Check if the configuration already exists. If it doesn't, add the external address configuration parameters to be used in the WebSocket connection to the end of the configuration file (in JSON format). For example:
{
    ...
    "dev": {
        "ws": {
          "host": "dev.netuno.org"
        }
    },
    ...
}
Port information should not be added to the host address in the WebSocket.
Multiple host addresses can also be passed in an array:
{
    ...
    "dev": {
        "ws": {
          "host": [ "my-container.dev.netuno.org", "my-project.com" ]
        }
    },
    ...
}
Production Proxy (NGINX)
In production, it's common to use a web server that acts as a reverse proxy, such as NGINX.
For debugging to work through a proxy, you need to add a specific configuration to route traffic related to the WebSocket address:
server {
    listen 443 ssl;
    server_name my-project.com;

    ...

    location /dev/ws/ {
        proxy_pass http://127.0.0.1:9000;
        proxy_set_header X-Real-IP $remote_addr;
        proxy_set_header X-Forwarded-For $proxy_add_x_forwarded_for;
        proxy_set_header Upgrade $http_upgrade;
        proxy_set_header Connection "Upgrade";
        proxy_http_version 1.1;
        proxy_read_timeout 86400s;
        proxy_send_timeout 86400s;
        add_header X-Frame-Options "";
    }
}
Conclusion
With the debugging interface and the _exec.debug() command, we can perform an in-depth investigation of what's
happening.
In most backend languages and technologies, especially scripting technologies, debugging is often impossible or complex.
Netuno offers a simple way to debug polyglot code that works in various supported languages, such as JavaScript, Python, Ruby, Kotlin, and Groovy.
It allows polyglot debugging in remote and production environments.
Using debugging greatly speeds up development, providing greater precision for troubleshooting, and it becomes an essential tool. Give it a try.